


We provided a comprehensive overview of what the P/E ratio is and how to use it to evaluate a stock’s potential. In this new blog post, we aim to build upon that foundation by diving deeper into the significance of P/E ratio in determining a stock’s value and how it can be used in conjunction with other financial metrics. We will also discuss What is the Good price per Earnings ratio in India sector wise. Whether you’re a seasoned investor or just starting out, this blog post will provide valuable insights and strategies for achieving financial success in the stock market.
First Lets revise How P/E ratio is Calculated step by step
The formula to calculate P/E ratio is as follows:
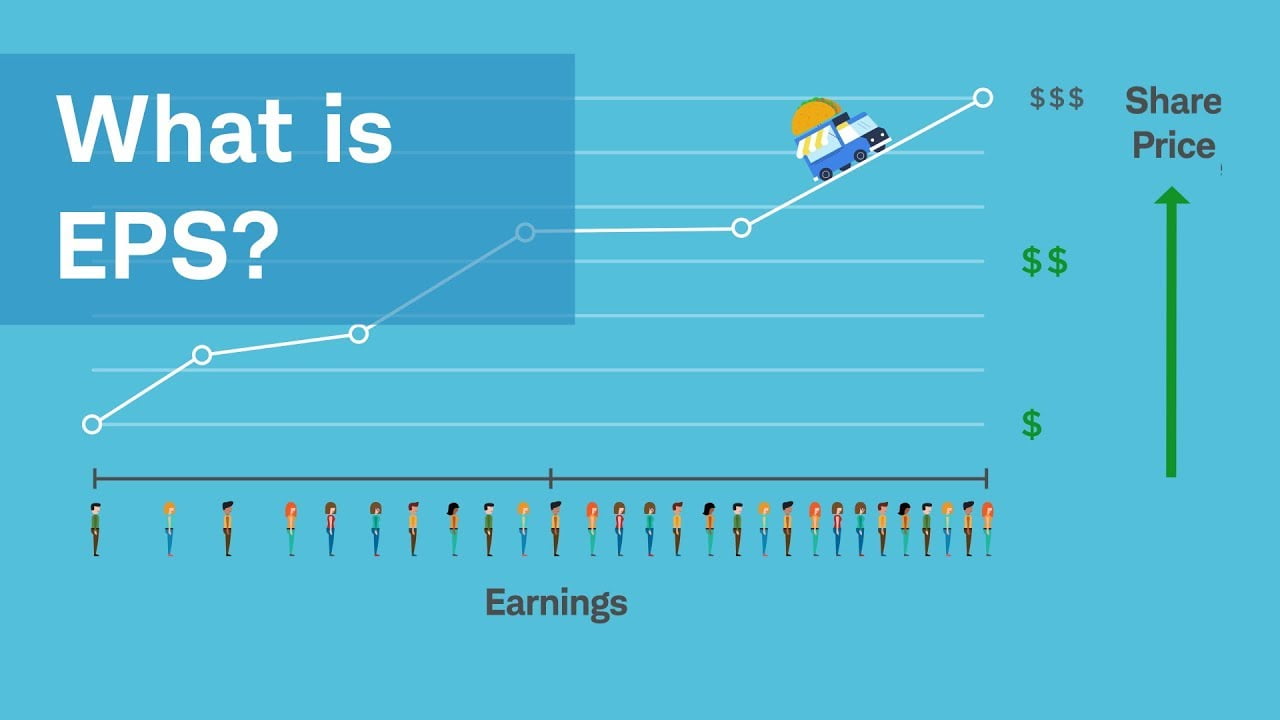
P/E ratio = Stock Price / Earnings per Share (EPS)
Step 1: Determine the current stock price. This information is readily available on most financial websites and can be obtained by searching for the stock’s ticker symbol.
Step 2: Calculate the earnings per share (EPS). This is calculated by dividing the company’s net earnings by the number of outstanding shares. This information can be found in the company’s earnings report or financial statements.
Step 3: Divide the stock price by the earnings per share (EPS) to calculate the P/E ratio. For example, if the current stock price is Rs.50 and the earnings per share is Rs.5, the P/E ratio would be 10 (Rs.50 / Rs.5).
How to Know stock I purchased has Good Price to Earnings Ratio
Determining a “good” P/E ratio is subjective and can vary depending on various factors such as the company’s industry, growth prospects, and financial stability. A high P/E ratio can indicate that the market has high expectations for the company’s future growth, while a low P/E ratio may suggest that the market has lower expectations or that the stock is undervalued.
As a general rule, a P/E ratio in the range of 20 to 35 is considered reasonable for most companies. A P/E ratio below 20 is generally considered low, while a P/E ratio above 35 is considered high. However, it’s important to keep in mind that these are general guidelines and may not apply in every case.
It’s also important to compare the P/E ratio of a company with its peers within the same industry to get a better sense of whether the P/E ratio is high or low. For example, a P/E ratio of 30 for a technology company might not be considered high, but for a utility company, it could be considered high.
Ultimately, the P/E ratio should be used as just one of many tools to evaluate a stock’s potential, and should be considered in conjunction with other financial metrics, such as earnings growth, revenue growth, debt levels, and cash flow.
Below is list of Average Price to Earnings ratio of Indian Stock Market Sector wise.
- Technology: 25-35
- Consumer goods: 25-35
- Healthcare: 20-30
- Banking: 15-20
- Energy: 10-15
- Telecommunications: 15-25
- Automobiles: 15-25
In 2023, the sectors that are typically pegged at high Price to Earnings (P/E) ratios in Indian stock markets include technology, consumer goods, and healthcare. These sectors often have higher P/E ratios due to their strong growth prospects, high revenue and earnings, and overall market demand for their products and services.
For example, technology companies, such as software and internet-based businesses, are often able to achieve strong revenue growth through innovation and expanding their customer base. This growth potential leads to higher P/E ratios, as investors are willing to pay a premium for the company’s future growth prospects.
Similarly, the consumer goods sector, which includes companies that produce and sell products such as food, beverages, and personal care items, also often has high P/E ratios due to its consistent demand and stable earnings.
In the healthcare sector, high P/E ratios can be attributed to the strong demand for healthcare services and products, as well as the high barriers to entry in the industry.
Price to Earnings (P/E) ratio of the Nifty 50
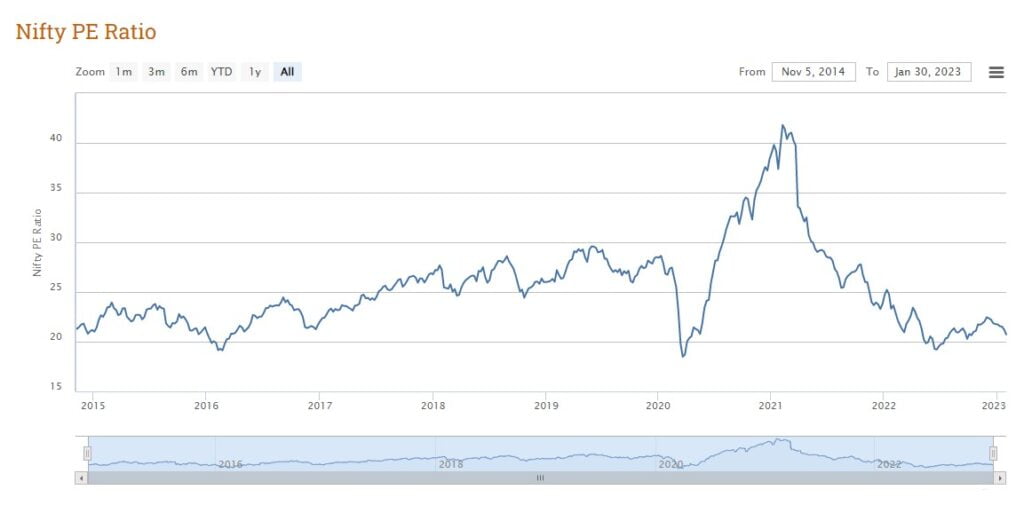
In 2015, the P/E ratio of the Nifty 50 was around 21, which was slightly above its historical average. Over the next two years, the P/E ratio increased, reaching a peak of around 27 in 2017. This increase was largely driven by a strong performance in the technology and consumer goods sectors.
In 2018, the P/E ratio of the Nifty 50 Increased, as the Indian stock market was impacted by Spurge in earnings by Service Industry. The P/E ratio Rise to around 28 by the end of the year.
In 2019 and 2020, the P/E ratio of the Nifty 50 remained relatively stable, hovering around the 22-23 mark. The Indian stock market was impacted by a variety of factors, including the COVID-19 pandemic and its impact on the global economy.
In 2021, the P/E ratio of the Nifty 50 increased, as the Indian stock market rebounded from the COVID-19 pandemic and investors became more optimistic about the future growth prospects of Indian companies. The P/E ratio reached around 27 by the end of the year.
Current Two year 2022 and 2023 PE Ratio Reached at its pick of 41 To average of 22 Again.
it Basically Tell us that PE ratio of Indian Markets are Averaged at 22-25.
We can Always Compare Stock that We want to Purchase to Average of Nifty 50. Just to check if Stock is Overvalued or Undervalued.
In Conclusion Purchasing stock at good P/E Ratio Increase chances Good returns in Future.
Purchasing a stock with a low P/E ratio can increase the chances of good returns in the future, as a low P/E ratio can indicate that a company is undervalued and has good growth potential.


One Response
Wow, these earrings are therefore versatile – they go well with both informal and formal looks.